
terra-lens-gov: squeezing certainty out of free satellite imagery
A satellite record is a strange thing to build on. Sentinel-2 gives you thirteen spectral bands over every point of the globe, every five days, back to 2015, for free. Abundant data, zero guarantee. terra-lens-gov is my R&D project on that gap: how much certainty can you squeeze out of free multi-band imagery before you have to admit the data doesn't know?
The question the project tries to answer, given a polygon and a time span, is "what changed, when, and how sure are we?" Not a red mask over a JPEG. A signed, dated statement that survives the follow-up question: how do you know?
And the raw material is genuinely exhilarating to work with. NDVI, NBR, the SWIR bands: simple ratios over thirteen channels of reflected light, and suddenly vegetation, burn scars and bare soil each have a signature you can compute. That part is pure joy. The hard part starts right after, because everything that can go wrong between the pixels and the sentence will go wrong. Here's a tour of the failure modes, because each one became a research problem with a measured answer.
Season looks exactly like change
Here is a rural parcel in Negros Oriental, February 2018 against June 2026, true colour. Drag the slider:
Any human sees construction within seconds: a road north, a diagonal track, bare strips. And yet almost half of that obvious change is season. February and June simply look different on farmland. Comparing same-season scenes eight years apart, the count of changed pixels drops by 47%, and what survives sits exactly on the road network. The parcel again: the two scenes, what a raw pair-diff flags, and what the detector signs after its full gate stack:

Third panel: pixels a single-pair diff flags. Fourth: what the certified detector actually signs (red), with ruptured pixels that failed the linearity gate in orange. The eye overcalls. The detector undercalls, by design.
First lesson of the project: the human eye is a change detector tuned for drama, and it overcalls. Anything the pipeline certifies has to beat season, not just differ from one arbitrary date.
Your reference state can absorb the thing you're looking for
Change detection needs a baseline: what did this pixel look like before? The naive design picks a fixed window, say the first 24 months of the record, and takes the median. That design has a failure mode I didn't see coming: if the change happens inside the window, the changed state enters the baseline. The road above was finished in October 2018, ten months into its own reference window. The detector had quietly learned that a road is what "normal" looks like there.
The fix is a rupture-first anchor. For each pixel, find the first scene where the value breaks (vegetation drop plus soil brightening), then compute that pixel's baseline from scenes strictly before the break. A step change can never contaminate its own reference again, by construction. The cost: some pixels anchor on as few as two early scenes, which is fragile, and the fragility is disclosed rather than hidden.
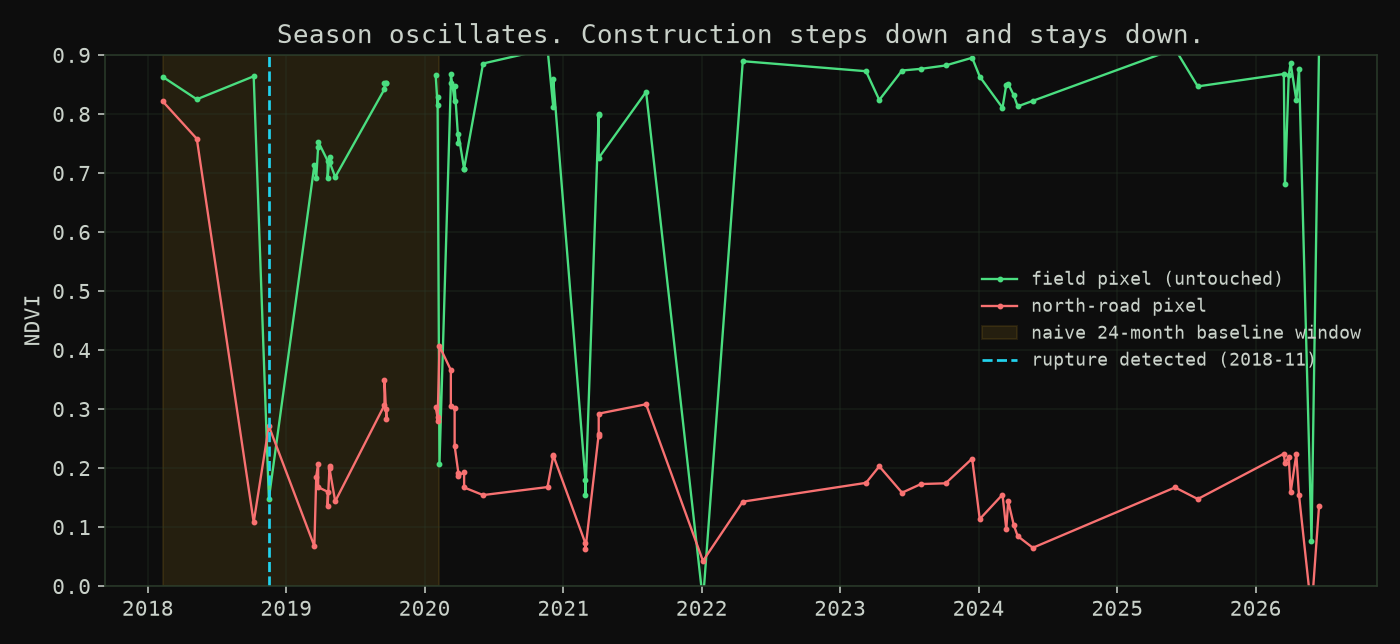
One pixel on the north road, one in an untouched field. The shaded band is the old fixed baseline window: the road's construction finishes inside it, which is how it contaminated the reference. The dashed line is the rupture the anchored detector fires on, November 2018.
The payoff is that change becomes datable. The rupture date is the construction date, at scene precision. On the parcel above: median November 2018, spread five months. Google Earth's historical layer puts the road between April 2017 and October 2018. Two independent records, same answer.
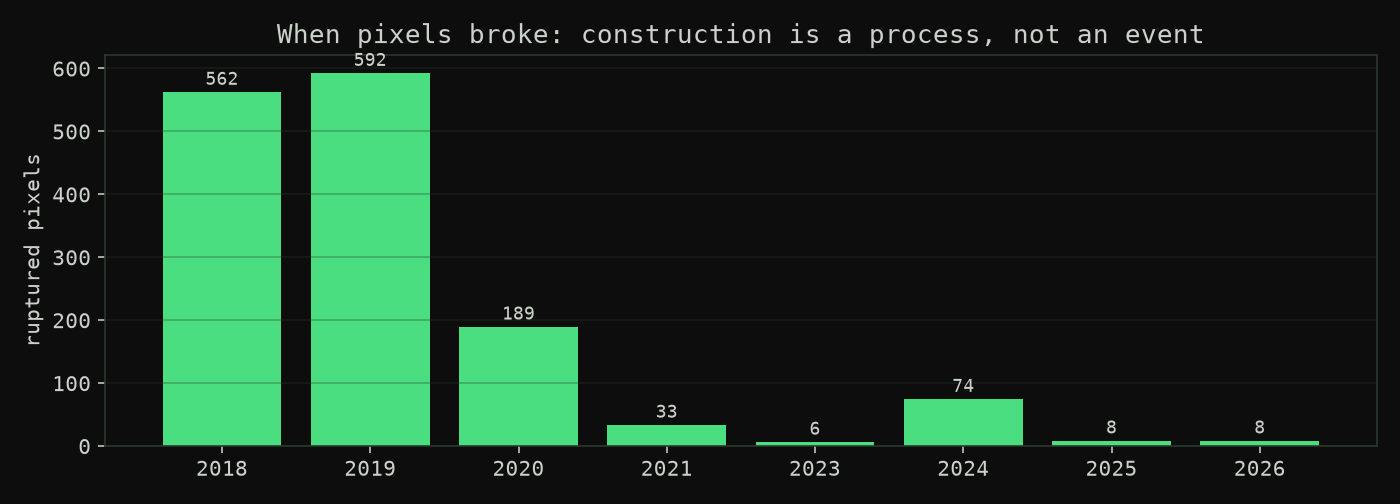
Rupture year for every pixel that ever crossed the trigger on this parcel. The works were a process spread across 2018 and 2019, not a single event.
Resolution is a contract, not a spec sheet
Sentinel-2 marketing says 10 metres. What that means in practice: the 20-metre road spans pixels and signs. The 10-metre track lives inside a single pixel and doesn't. Single-pixel features are exactly what the minimum-mapping rules exist to reject, because single pixels are also where noise lives.
So the project publishes floors instead of pretending they don't exist: compact conversions around 1.2 hectares and up sign cleanly, wide linear corridors sign and date, narrow tracks fall below the floor and the contract card says so. Below that floor, the honest answer is "this needs finer imagery," which is a product boundary, not an embarrassment.
Different causes, same spectrum
The nastiest discovery came from fixing the baseline bug: three control parcels that were supposed to stay silent all fired on the same date, 14 March 2024. Vegetation collapsed, bare soil brightened, and it never recovered. Spectrally, a burn scar that never regrows and a graded building pad are the same object.
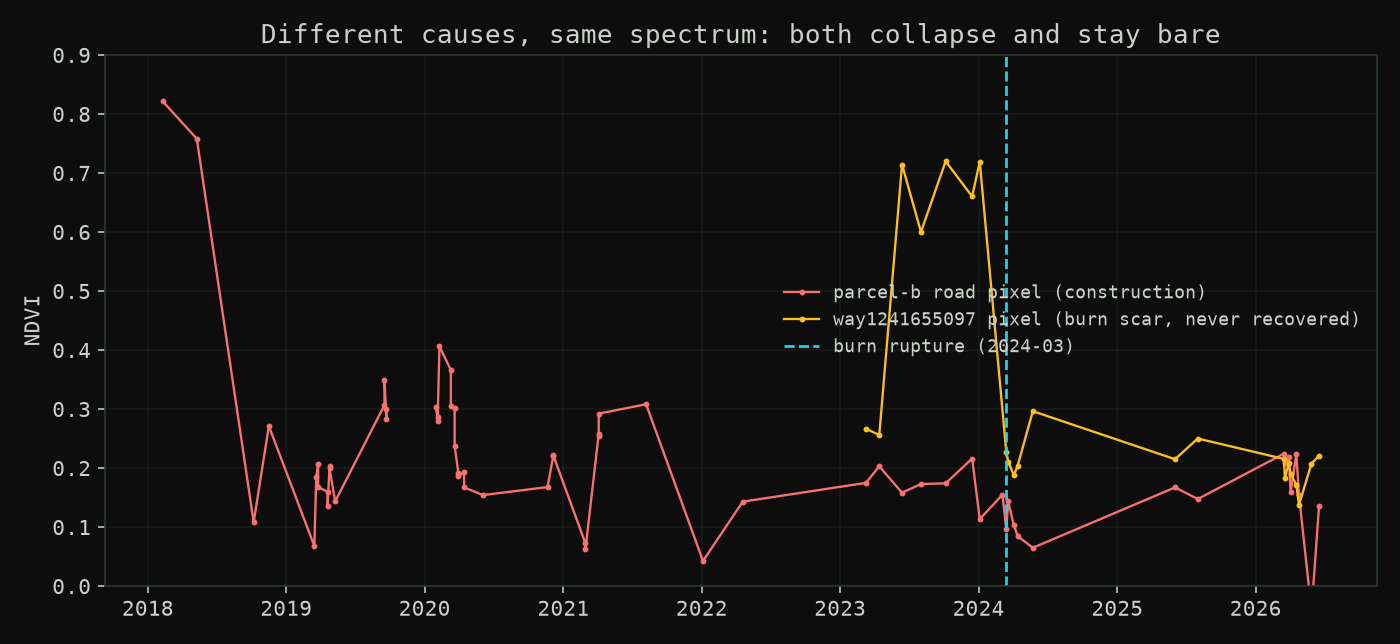
A burn pixel from the control cluster against the construction pixel. Same collapse, same persistence, different cause. This is the confusion the false-positive number pays for.
Ground truth confirmed all three are burns. We threw the obvious discriminants at the problem, scar-scene shape and burn-severity indices, and both failed on the record (one couldn't see the fire scene through cloud gaps, the other can't separate cause from severity). So the current state of the research is a published number, not a fix: 3 false positives out of 24 controls, 12.5%, Wilson interval 4.3 to 31.0. Wide, honest, and the reason a wider ground-truthed control corpus is being gathered right now.
Confidence needs a second satellite
One more axis the project makes explicit: detection and replication are different things. A signal seen by one satellite is a claim; the same signal seen independently by another satellite in the same constellation is a measurement. The confidence ladder (UNOBSERVED to OBSERVED) requires that cross-platform split for its top tier. When recent windows are thin on one platform, an event stays at LIKELY even when it's real. Annoying, conservative, correct.
The epistemics are part of the engineering
Because the deliverable is a defensible statement, the methodology is engineered like the code: detector rules are committed to git before any measurement runs, pre-registration style, so nobody tunes thresholds until the output says what we hoped. Calibrations replay byte-identically from committed caches. Each detector ships a contract card with its class, its floor, and its measured false-positive rate on a disclosed sample. And no language model touches the measurement loop: report prose can be generated, numbers can't.
The stack, since this is still a backend blog
The repo is a uv workspace, Python 3.12, and the pipeline's whole dependency list fits in one line: numpy, rasterio, PyYAML, reportlab. No geopandas, no ML framework, no GPU. Detection is explicit algebra over band ratios plus spatial gates; when you can't afford to retrain your credibility, simple beats smart.
Imagery comes from anonymous STAC queries against Element84's Earth Search (Sentinel-2 L2A on AWS). Every fetched window lands in a per-parcel local cache, and here's the part that makes the epistemics above physically possible: research runs never touch the network. They replay from committed caches, which is why a calibration can be byte-identical twice in a row, and why a reviewer can re-run my numbers without an API key.
The flow, as Makefile targets: parcel-onboard turns a GeoJSON polygon into a manifest, parcel-fetch runs the STAC search, filters clouds, masks SCL classes and fills the cache, parcel-report runs the detectors (rupture anchor, gates, linearity, platform-split confidence lattice) and emits a delivery bundle: before/after photos, an interactive map, a PDF report via reportlab. land-history-bundle packs the public catalogue, viewer-build builds the static JS viewer that serves it. A parallel chain does the same for Sentinel-1 SAR. Detectors are plugins under services/pipeline/app/detectors/, each with a contract card in docs/contracts/detectors/.
The acceptance gates are Makefile targets too, and they run before every milestone flip: doctor (manifest validation across the repo), lint, test-unit (395 tests as of this writing), tier1-conformance, and no-private-contact-data-check, because the repo also carries client data and the boundary is enforced by a test, not by good intentions. The whole thing is driven by agents through pre-registered milestone packs with countersigned gates; the protocol is written down in docs/orchestrator-operations.md, and it's the reason the "we didn't tune after looking" claims above are checkable rather than vibes.
What's next
The open threads: tightening the burn-versus-works separation with the new corpus, dating events at month precision across longer archives, spectral unmixing to push the floor below the 10-metre track (a mixed pixel contains a track's worth of bare soil even when the pixel never fully flips), and SAR co-evidence for cloud season. The record is free and growing by two scenes a week. The certainty is the part you build.
Code, contract cards, and the milestone archive are on the Marklar GitLab. The research runs in the open, wrong turns included.